Table of content
Whether you're tracking inflation, sales growth, weight loss, or your investment returns — percentage change sneaks into more conversations than you'd expect. It's one of those math tools that quietly powers the way we measure and compare the ups and downs in life, business, and science. If you are working with percentage, our Percentage Calculator will be your assistant.
What Is Percentage Change?
If you’ve ever said “That price went up by 10%” or “My test score dropped 15%,” you were using percentage change — whether you realized it or not. At its core, percentage change is a way to measure how much something has increased or decreased in comparison to where it started. It puts change into perspective, allowing comparisons across different scales, currencies, or units.
In technical terms, the formula is: Percentage Change = ((New − Old) ÷ Old) × 100%
This expression tells you how much something has changed relative to its original value. The result is expressed as a percentage, so whether you’re dealing with prices, populations, or profits, the concept stays consistent.
You’ll see percentage change used all over the place:
-
In economics, it helps measure inflation, GDP growth, or unemployment swings1.
-
In personal finance, it shows investment returns, spending changes, or savings goals.
-
Academic grading often uses it to show improvements or drops between exams.
-
In healthcare, researchers use percentage change to report changes in disease incidence or treatment outcomes.
Let’s look at a basic example. Suppose your electricity bill was 120lastmonthand150 this month. The percentage change would be:
((150 − 120) ÷ 120) × 100% = (30 ÷ 120) × 100% = 25%
So, your bill increased by 25%.
Likewise, if a smartphone drops from 999$ to 799$, the decrease would be:
((799 − 999) ÷ 999) × 100% = (−200 ÷ 999) × 100% ≈ −20.02%
That’s a 20% decrease — a more meaningful figure than just saying “it’s $200 cheaper.”
📉 Fun Fact: In 1979, the U.S. inflation rate hit 13.3% — the highest annual percentage change in consumer prices since World War II3.
Percentage change isn’t just about raw numbers. It brings clarity. A $500 drop in one company stock price might sound dramatic — until you learn it was trading at $5,000 . That’s only a 10% drop. But if another company’s stock drops from 50$ to 25$, that’s a 50% crash. Percentages give us context.
Percentage Increase and Decrease
When people talk about percentage change, they often mean one of two things — either something went up or it went down. These are technically referred to as percent increase and percent decrease.
The math behind both is the same:
Percentage Change = ((New − Old) ÷ Old) × 100%
What makes the difference is whether the result is positive (increase) or negative (decrease).
Let’s break that down with a few practical examples:
-
If your salary goes from 60,000to66,000 that’s:
((66,000 − 60,000) ÷ 60,000) × 100% = 10%. A clear 10% raise. -
But if it drops from 60,000to54,000 the formula becomes:
((54,000 − 60,000) ÷ 60,000) × 100% = −10%. That’s a 10% decrease.
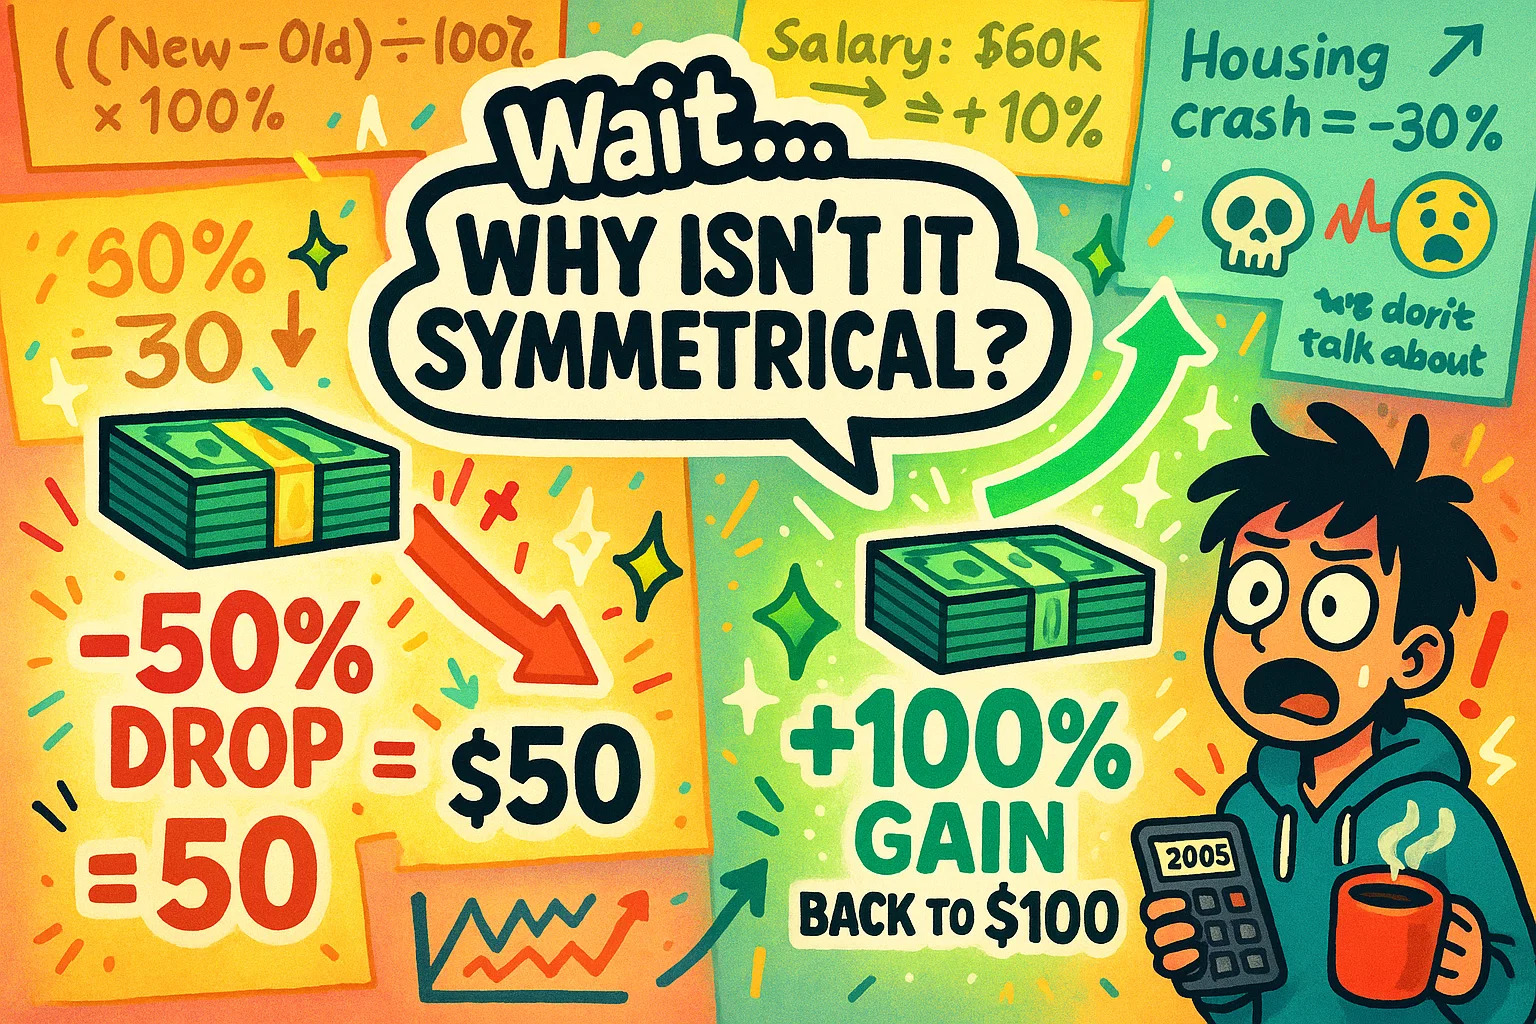
This may sound simple — but percentages have quirks that can easily confuse. One of the most surprising is how increases and decreases aren’t symmetrical. If a stock drops 50%, it doesn’t need to go up 50% to recover. It needs to go up 100% to return to its original value.
For example:
-
If a 100investmentdrops5050.
-
To get back to $100, it must double — a 100% increase.
⚠️ Quick Stat: During the 2008 financial crisis, many U.S. home values dropped by more than 30%. It took over a decade for some markets to fully recover to their pre-crash values.
This is why percentage change is such a vital tool in finance, economics, and data analysis — it tells the real story, not just raw dollar amounts. Whether you're evaluating an investment rebound or a shrinking market, focusing on how much it changed compared to where it started is key.
Percentage Point vs. Percent Change
Let’s say interest rates go from 2% to 3%. Did they rise 1% or 50%?
The answer is: both — depending on what you're measuring.
Here’s the catch:
-
A change from 2% to 3% is a 1 percentage point increase.
-
But in terms of percent change, it’s a 50% increase relative to the original value.
((3 − 2) ÷ 2) × 100% = 50%
This difference between percentage points and percent change is subtle but crucial. It trips up journalists, investors, and even policymakers when they mix up the two. Percentage points are absolute changes in percent-based values. Percent change is relative to the original figure.
You’ll often see this confusion in:
-
Poll results (e.g., approval rating shifts from 40% to 45%)
-
Interest rates
-
Tax rate proposals
-
Medical studies comparing risk rates
Let’s look at a public health example:
If a drug reduces the risk of a condition from 4% to 2%, that’s a 2 percentage point drop — but a 50% decrease in risk. It’s a big difference in how the result is perceived.
🧪 Fun Fact: A study in the New England Journal of Medicine found that patients are more likely to accept a treatment when its benefits are expressed in percent change, even if the absolute benefit (percentage point difference) is small.
Media headlines love percent changes because they sound dramatic. But if you want to be informed — especially when reading financial reports or health stats — pay attention to which type of change is being reported.
Most of the time, percentage change is straightforward. But real-world scenarios aren’t always one-and-done. Sometimes you’re working backward to find what something used to be, or trying to measure growth over time. That’s where the basic formula gets a bit of an upgrade.
Finding the Original Value
Say you know a final price after a 20% increase — for example, an item costs $120 now, but you want to know what it cost before the increase. You can’t use the standard formula in reverse, so instead, flip it:
Old = New ÷ (1 + Change%)
In this case: Old = 120 ÷ 1.20 = 100
So the original price was $100.
This version of the formula is handy in:
-
Retail (finding original prices before a markup)
-
Finance (back-calculating returns)
-
Salary negotiations (determining prior income before a raise)
And yes — if the value decreased instead of increased, you’d subtract the percentage instead:
Old = New ÷ (1 − Change%)
Growth Over Time? Bring in the Exponent
If something grows or shrinks repeatedly, you’re in the world of compound change. That could be investments, interest, populations, or even subscriptions.
Here’s the formula:
Final = Initial × (1 ± Change%)ⁿ
Where:
-
Change% is expressed as a decimal (e.g. 5% = 0.05)
-
n is the number of periods (years, months, etc.)
Let’s say a city’s population grows 2% per year. After 5 years, the change would be:
Final = Initial × (1 + 0.02)⁵
This version helps when you’re looking at trends over time — not just a one-time change.
🔍 Fact Check: The U.S. Census Bureau uses compound annual growth rates (CAGR) to track long-term changes in population and income levels.
For more advanced or nested calculations, you can jump to our Math Calculator to break things down further.
Grades, Raises, and Budgets
Percentage change isn’t just for economists and analysts — it shows up in everyday decisions that affect your job, your education, and your money.
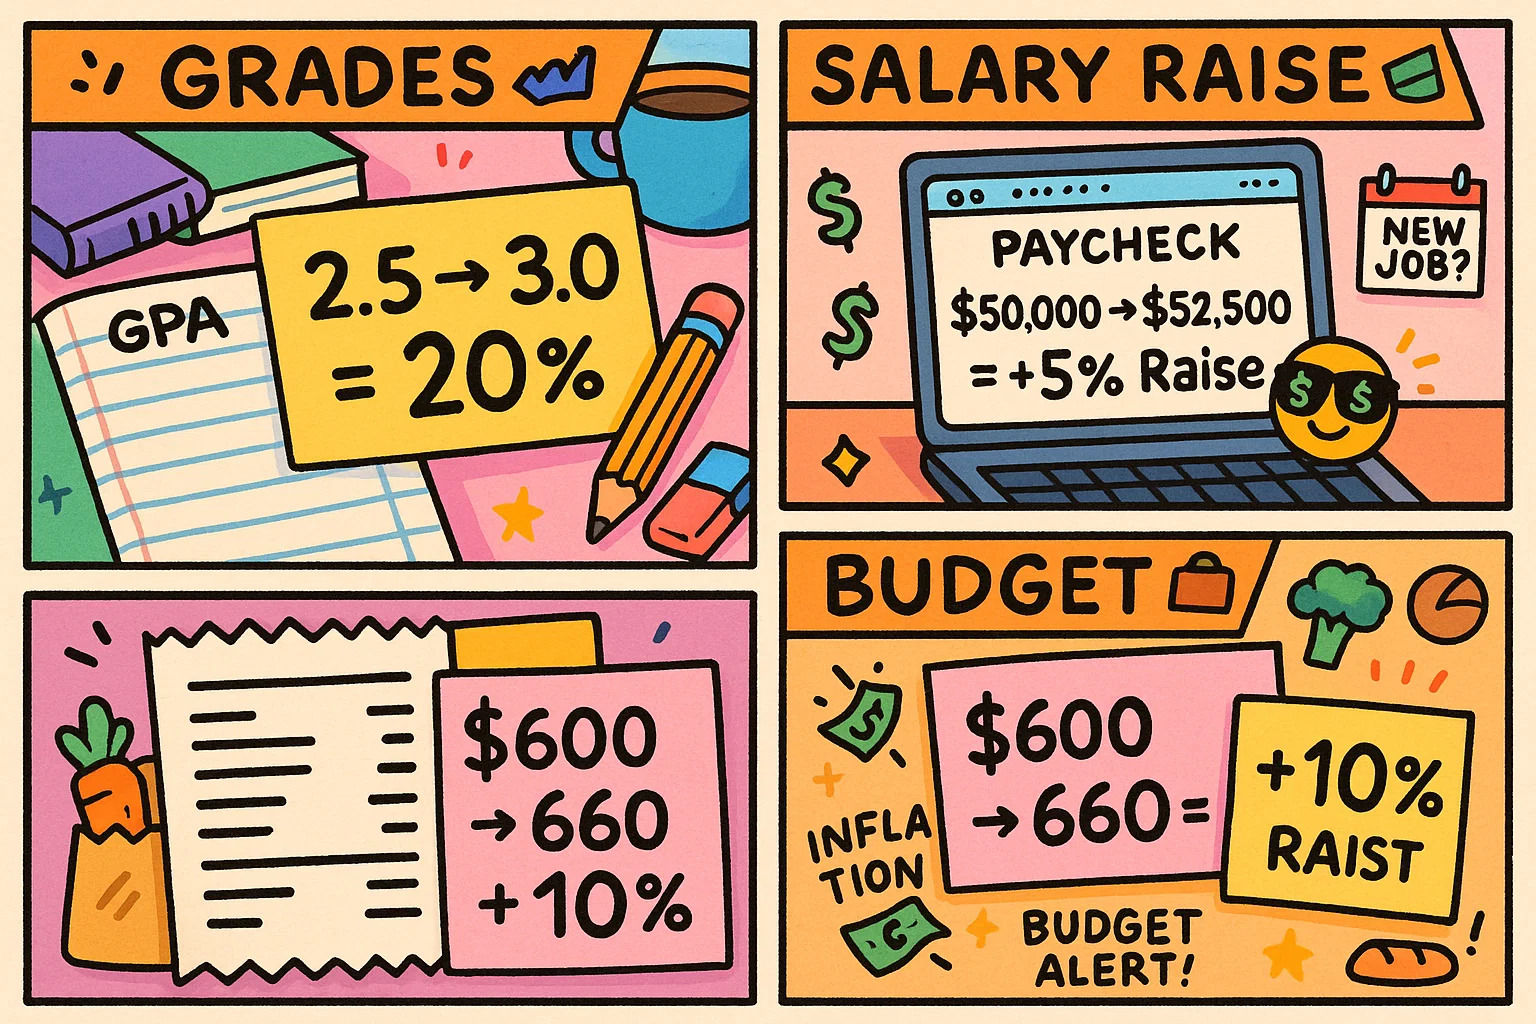
Take grades, for example. Let’s say your GPA was 2.5 last semester and bumped to 3.0 this term. That’s not just “half a point better” — it’s a 20% improvement:
((3.0 − 2.5) ÷ 2.5) × 100% = 20%
Students and teachers often track academic progress using percentage change to show how far someone’s come — not just where they ended. It’s especially helpful when applying for scholarships or academic programs that care about upward trends. If you’re doing this kind of comparison often, check out our GPA Calculator to make the math simpler.
The same goes for salary negotiations. A 5% raise on a 50,000salarybringsyouto52,500. If you’re switching jobs, hiring managers may ask how much of an increase you’re expecting — and you’ll likely frame your ask as a percentage, not just a dollar amount. That’s why many HR tools include Salary Calculators to help you prep.
💼 Fun Fact: According to the U.S. Bureau of Labor Statistics, the average wage increase in 2023 was around 4.4%, but that varied sharply by industry.
And for budget planning — both personal and business — tracking year-over-year percentage changes is key. If your grocery budget rose from 600to660/month, that’s a 10% jump. Spotting these shifts early can keep your spending in check, especially in times of inflation.
Need help crunching those numbers? Our Math Calculator can break down both one-time and recurring percentage changes across income, expenses, or savings.