
Table of content
Fuel consumption plays a key role in daily life, affecting costs, travel, and environmental impact. This guide explores how fuel efficiency is measured worldwide, from miles per gallon (MPG) to liters per 100km, factors that influence usage, and practical tips for driving smarter and saving more.
What Is Fuel Consumption?
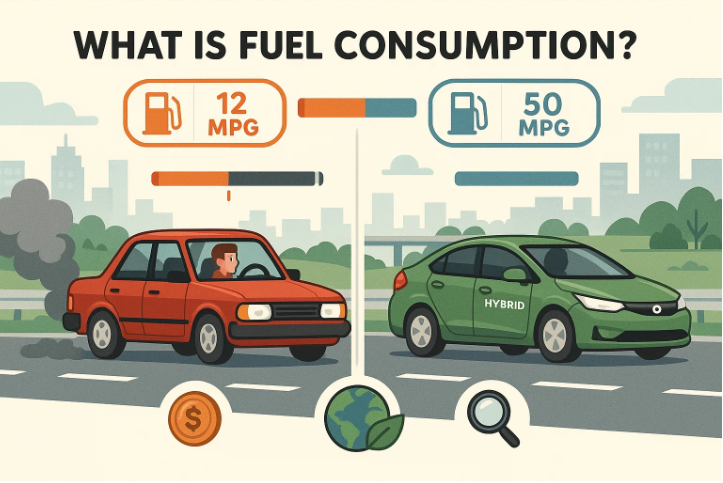
Fuel consumption is simply how much fuel a vehicle uses to cover a certain distance. Some countries measure it as liters per 100 kilometers (L/100 km), while others, like the U.S. and U.K., use miles per gallon (MPG)(1). Both describe the same thing — how thirsty a car is on the road — just in different units.
The number matters for two reasons: your wallet and the air we breathe. Every gallon of gasoline burned releases about 19.6 pounds (8.89 kg) of carbon dioxide into the atmosphere(2). That adds up quickly, considering the average driver covers thousands of miles a year. At the same time, fuel is one of the largest ongoing costs for car owners, so keeping an eye on how much your vehicle consumes can save a noticeable chunk of money over time.
Across the world, the measurement differs:
-
MPG (miles per gallon) is the standard in the U.S. and U.K. Higher numbers mean better efficiency.
-
L/100 km (liters per 100 kilometers) is used in Canada, Europe, and elsewhere. Lower numbers are better here, since they represent less fuel burned over the same distance(3).
To put it into perspective, a car that achieves 30 MPG burns roughly 7.8 liters of fuel per 100 kilometers. Same efficiency, just two ways of saying it.
🙋♂️Drivers who need to compare fuel economy across systems — from MPG to L/100 km and beyond — can use our Conversion Tools to make quick, accurate comparisons.
How Fuel Consumption Is Calculated
Fuel consumption isn’t just a random figure on a vehicle’s spec sheet — there’s math behind it, and it changes depending on where you live. Most countries use one of two systems to express how efficient a car is: liters per 100 kilometers (L/100 km) or miles per gallon (MPG). Both measure the same thing, but the numbers look very different because one shows how much fuel is used, while the other shows how far a car can go on a certain amount of fuel.
In the L/100 km system (common in Europe and Canada), the calculation is simple:
\[\text{Fuel Consumption (L/100 km)} = \frac{\text{Liters of fuel used}}{\text{Distance driven in km}} \times 100\] For example, if a car burns 5 liters of fuel over 100 kilometers, its rating is 5 L/100 km — lower is better here because it means the car is using less fuel to travel the same distance.
In the MPG system (used in the U.S. and U.K.), the math works the other way around:\[\text{Fuel Economy (MPG)} = \frac{\text{Miles driven}}{\text{Gallons of fuel used}}\] If a car drives 300 miles on 10 gallons of fuel, the rating is 30 MPG — higher is better because it shows the car can travel farther on a single gallon.
Government agencies like the EPA (Environmental Protection Agency) in the U.S. and the European Commission’s WLTP program test cars under controlled conditions so drivers can compare vehicles fairly(4). These tests simulate a mix of city and highway driving, using standardized speeds and conditions, because real-world factors like traffic and weather can change fuel use dramatically.
Fuel Economy Standards and Units
Fuel consumption isn’t measured the same way everywhere. Around the world, there are dozens of different units used to express how efficiently a vehicle uses fuel. Most drivers are familiar with liters per 100 kilometers (L/100 km) or miles per gallon (MPG), but many other units exist, especially in technical contexts or when working with specialized conversions.
At the core, many of these units can be expressed relative to meter per liter (m/L) — a baseline measure that shows how far a vehicle can travel on one liter of fuel. From there, you can scale up or down into larger or smaller units:
-
Exameter per liter (Em/L) = 1.0 × 10¹⁸ m/L
-
Petameter per liter (Pm/L) = 1.0 × 10¹⁵ m/L
-
Terameter per liter (Tm/L) = 1.0 × 10¹² m/L
-
Gigameter per liter (Gm/L) = 1.0 × 10⁹ m/L
-
Megameter per liter (Mm/L) = 1.0 × 10⁶ m/L
-
Kilometer per liter (km/L) = 1,000 m/L
-
Hectometer per liter (hm/L) = 100 m/L
-
Dekameter per liter (dam/L) = 10 m/L
-
Centimeter per liter (cm/L) = 0.01 m/L
In addition to metric-based scales, other distance-per-fuel measures include:
-
Mile (U.S.) per liter (mi/L) = 1,609.344 m/L
-
Nautical mile per liter (n.mile/L) = 1,853.24496 m/
-
Nautical mile per gallon (U.S.) = 489.5755247 m/L
-
Kilometer per gallon (U.S.) = 264.1720524 m/L
-
Meter per gallon (U.S.) = 0.2641720524 m/L
-
Meter per gallon (U.K.) = 0.2199687986 m/L
-
Mile per gallon (U.S.) = 425.1437075 m/L
-
Mile per gallon (U.K.) = 354.00619 m/L
There are also volume-based comparisons where meters of travel are measured per different fuel volumes, such as:
-
Meter per cubic meter (m/m³) = 0.001 m/L
-
Meter per cubic centimeter = 1,000 m/L
-
Meter per cubic yard (m/yd³) = 0.0013079506 m/L
-
Meter per cubic foot (m/ft³) = 0.0353146667 m/L
-
Meter per cubic inch (m/in³) = 61.02374409 m/L
And for more granular or practical household units:
-
Meter per quart (U.S.) = 1.056688209 m/L
-
Meter per quart (U.K.) = 0.8798751948 m/L
-
Meter per pint (U.S.) = 2.113376419 m/L
-
Meter per pint (U.K.) = 1.759750389 m/L
-
Meter per cup (U.S.) = 4.226752838 m/L
-
Meter per cup (U.K.) = 3.519500777 m/L
-
Meter per fluid ounce (U.S.) = 33.8140227 m/L
-
Meter per fluid ounce (U.K.) = 35.19500777 m/L
Finally, there are inverse-style units commonly used to show consumption over distance:
-
Liter per meter (L/m) = 1 m/L (direct reciprocal).
-
Liter per 100 kilometers (L/100 km) = 100,000 m/L (the standard consumption unit in many countries).
-
Gallon (U.S.) per mile = 425.1437075 m/L.
-
Gallon (U.S.) per 100 miles = 42,514.3707 m/L.
-
Gallon (U.K.) per mile = 354.0061899 m/L.
-
Gallon (U.K.) per 100 miles = 35,400.6189 m/L.
While many of these units aren’t commonly used by everyday drivers, they’re essential for engineers, researchers, and anyone working with international fuel economy standards. Converting between them helps standardize data, making it possible to compare efficiency across countries, industries, and testing cycles.
Factors That Affect Fuel Consumption
Fuel consumption isn’t fixed. Even two identical cars can burn fuel differently depending on how they’re driven, where they’re driven, and how well they’re maintained. While vehicle manufacturers provide official fuel economy ratings, real-world results often vary because of several key factors.
The Vehicle Itself
-
Weight and Size – Heavier vehicles need more energy to move, so trucks and SUVs typically burn more fuel than compact cars.
-
Aerodynamics – Boxier designs create more drag, forcing the engine to work harder, especially at highway speeds.
-
Engine Type and Technology – Turbocharged, hybrid, or newer engines often deliver better fuel efficiency by optimizing power output and reducing waste.
-
Tires and Rolling Resistance – Underinflated or aggressive off-road tires can increase friction and lower mileage significantly.
The Way You Drive
-
Speed and Acceleration – Driving fast, flooring the accelerator, or braking hard wastes energy. Tests by the U.S. Department of Energy show aggressive driving can cut highway fuel efficiency by up to 30%(5).
-
Idling and Stop-and-Go Traffic – Idling burns fuel without moving the car, while frequent stops cause the engine to use more energy to restart momentum.
-
Cruise Control Use – On flat highways, using cruise control helps maintain steady speeds and improves fuel economy.
Environmental Conditions
-
Temperature – Cold weather makes engines less efficient, and running heaters or defrosters increases fuel usage.
-
Road Conditions and Terrain – Steep hills, rough roads, or unpaved routes require more power, raising consumption.
-
Altitude – Engines often burn more fuel at higher elevations because of thinner air, though turbocharged engines are less affected.
💡Quick Fact: "Tests by the Environmental Protection Agency show that simply keeping tires properly inflated can improve fuel economy by 3% — enough to save the average driver about $0.10 per gallon.”(6)
Fuel Quality and Type
-
Octane Rating – Unless a car specifically requires premium gas, using it doesn’t improve mileage.
-
Ethanol Blends – Fuels with higher ethanol content (like E85) generally reduce energy content per gallon, leading to more fuel burned per mile.
All of these variables combine to determine how much fuel a car actually uses on the road. Small changes in driving habits and maintenance can make a noticeable difference over time, saving money and reducing emissions.
Environmental and Economic Impact
Every drop of fuel burned does more than move a vehicle forward — it leaves a mark on both the planet and your wallet. Gasoline and diesel are carbon-based fuels, which means burning them releases carbon dioxide (CO₂) into the atmosphere. On average, every gallon of gasoline produces about 19.6 pounds (8.89 kilograms) of CO₂, while a gallon of diesel produces even more, roughly 22.4 pounds (10.16 kilograms)(7). Those numbers add up quickly: a typical passenger car in the U.S. emits over 4.6 metric tons of CO₂ per year just from driving(8).
The economic side is just as significant. The U.S. Department of Energy estimates that fuel makes up about 25% of the total cost of owning and operating a vehicle annually(9). Improving a car’s fuel efficiency by just 10% can save the average driver 150−300 per year depending on fuel prices and mileage. Fleet operators, like trucking companies, can save thousands annually per vehicle by focusing on efficiency improvements, from proper maintenance to driver training.
Reducing fuel consumption benefits more than just your bank account:
-
It cuts greenhouse gas emissions, slowing the impact of climate change.
-
It reduces demand for fossil fuels, helping to conserve nonrenewable resources.
-
It lowers air pollutants like nitrogen oxides and particulate matter, improving air quality in urban areas.
🔎Did You Know? “If every U.S. driver improved their average fuel economy by just 1 mile per gallon, it would save about 1.3 billion gallons of fuel annually — the equivalent of taking over 2 million cars off the road for a year.”(10)
For drivers, these benefits stack together. Using less fuel means spending less at the pump, while also doing a part to shrink your carbon footprint. It’s one of the few areas where saving money and helping the planet can go hand in hand.
For more ways to cut your carbon footprint, check out our Carbon Footprint Calculator.
The $2,000 Tank: What Fuel Really Costs the Average Driver
For most drivers, the cost of fuel isn’t just a minor line on the budget — it’s a major monthly expense. According to the U.S. Department of Energy, the average American driver spends over $2,000 each year on fuel alone, depending on vehicle type and local prices(11). That’s more than many people spend on car insurance, maintenance, or even public transportation in a year.
The number can swing even higher for drivers of larger vehicles like trucks and SUVs, or for those who face long commutes. Rising gas prices over the past decade have only amplified the impact, making fuel efficiency a top concern for anyone who drives regularly.
💡Quick Fact: “A commuter traveling 15,000 miles annually in a car averaging 25 MPG will burn through about 600 gallons of fuel each year — adding up to nearly 12,000 pounds of CO₂ emissions in the process.”(12)
This reality explains why fuel efficiency ratings and strategies to cut consumption aren’t just about helping the planet. They’re about helping drivers keep more money in their pockets, especially as fuel costs remain unpredictable.
- U.S. Department of Energy – Fuel Economy Basics
-
Environmental Protection Agency – Greenhouse Gas Emissions from a Typical Passenger Vehicle
-
Natural Resources Canada – Fuel Consumption Ratings
-
Environmental Protection Agency – Fuel Economy Testing and Labeling
-
U.S. Department of Energy – Driving More Efficiently
-
Environmental Protection Agency – Gas Mileage Tips
-
Environmental Protection Agency – Greenhouse Gas Emissions from a Typical Passenger Vehicle
-
U.S. Department of Transportation – Transportation Climate Impact Reports
-
U.S. Department of Energy – Annual Transportation Energy Data Book
-
Environmental Protection Agency – Fuel Economy and Emissions Facts
-
U.S. Department of Energy – Annual Transportation Energy Data Book
- Environmental Protection Agency – Greenhouse Gas Emissions and Energy Use for Passenger Vehicles