Standard deviation is one of those terms you probably heard in school — maybe during a math class or buried somewhere in a research report. But behind the intimidating name is a surprisingly intuitive concept that quietly powers everything from scientific discoveries to business strategies and weather forecasts. In the simplest terms, it’s how we understand spread — how far things are drifting from the center, whether that’s test scores, prices, or patient outcomes. Knowing how to measure variability gives us clarity, context, and confidence in the data we use every day.
Check Math to get more calculators
What Exactly Is Standard Deviation?
Standard deviation measures how spread out the values in a dataset are. Think of it as a way to answer the question: “How much do the numbers deviate from the average?”
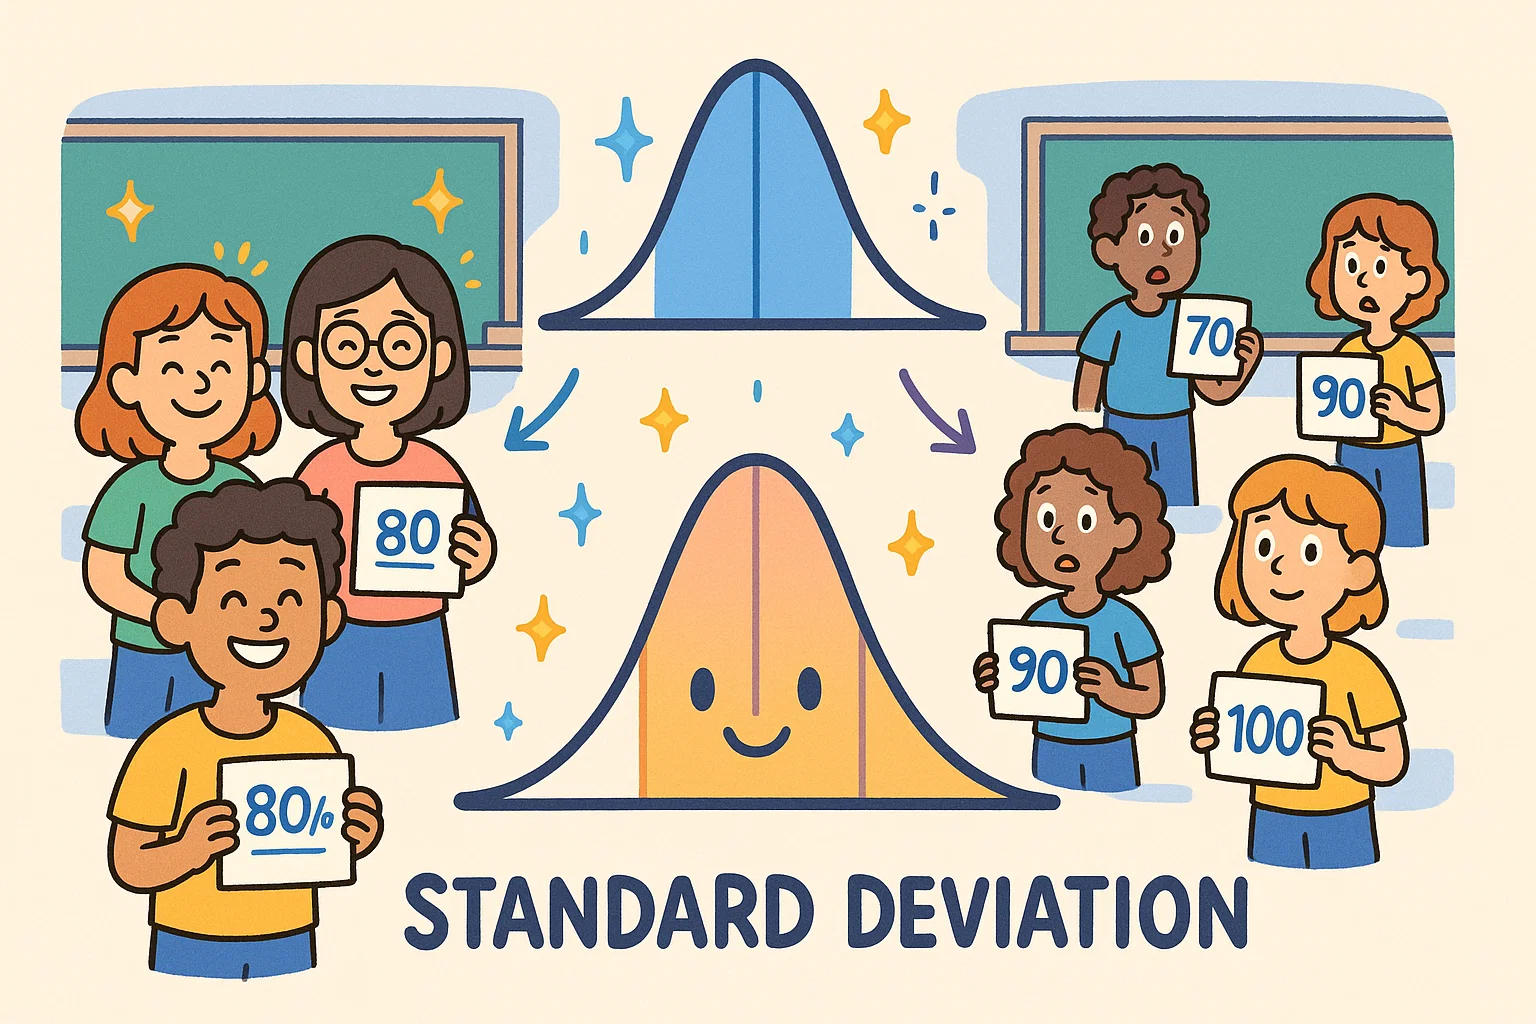
Let’s say a teacher gives a quiz and the entire class scores exactly 80 out of 100. The average is 80, and every student hit that number — so the standard deviation is zero. There’s no variability at all. Now imagine a second class with the same average score of 80, but their actual grades were 60, 70, 90, and 100. Although the average is still 80, the scores are all over the place. That second class has a much higher standard deviation.
A low standard deviation means the data points are tightly clustered around the mean; a high one means they’re more spread out.

Why Do We Care About Variability in Data?
Variability isn’t just statistical noise — it tells a story. By measuring how much data fluctuates, standard deviation helps us spot trends, outliers, and hidden patterns. In healthcare, it’s used to assess whether a treatment has consistent effects. In climate science, it helps track unusual shifts in temperature over time. Educators use it to analyze student performance across schools, while engineers rely on it for quality control. Without understanding variability, we risk misreading what the data really says.
Try related tools: Mean Calculator, Variance Calculator, or Z-Score Calculator to explore more ways data tells its story.
Population Standard Deviation
When you have data from the entire population you're studying, you can calculate the population standard deviation without needing to estimate it. This method helps determine the exact degree of variability of the entire dataset, such as when you have data from all individuals in a population or all points in a comprehensive survey study.
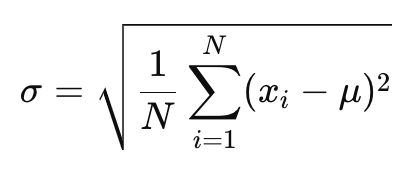
Population standard deviation formula:

Where:
𝜎: is the population standard deviation,
𝑁: is the number of observations in the dataset (population size),
xi: is each value in the dataset,
𝜇: is the mean of the population.
Sample Standard Deviation
This is used when you only have a sample of data representing the population. Since it’s not possible to have the entire population data, the sample standard deviation helps estimate the population standard deviation based on the sample data you have. The sample standard deviation includes a "correction" to account for the potential bias in the estimation, ensuring that the measure doesn’t underestimate the degree of dispersion.
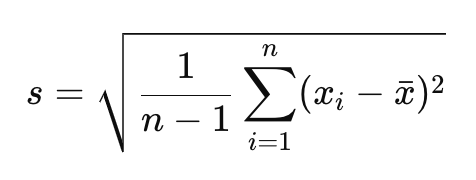
Formula for sample standard deviation:
Where:
𝑠: is the sample standard deviation,
𝑛: is the number of observations in the sample,
x: is the mean of the sample.
Bell Curves and Normal Distributions.
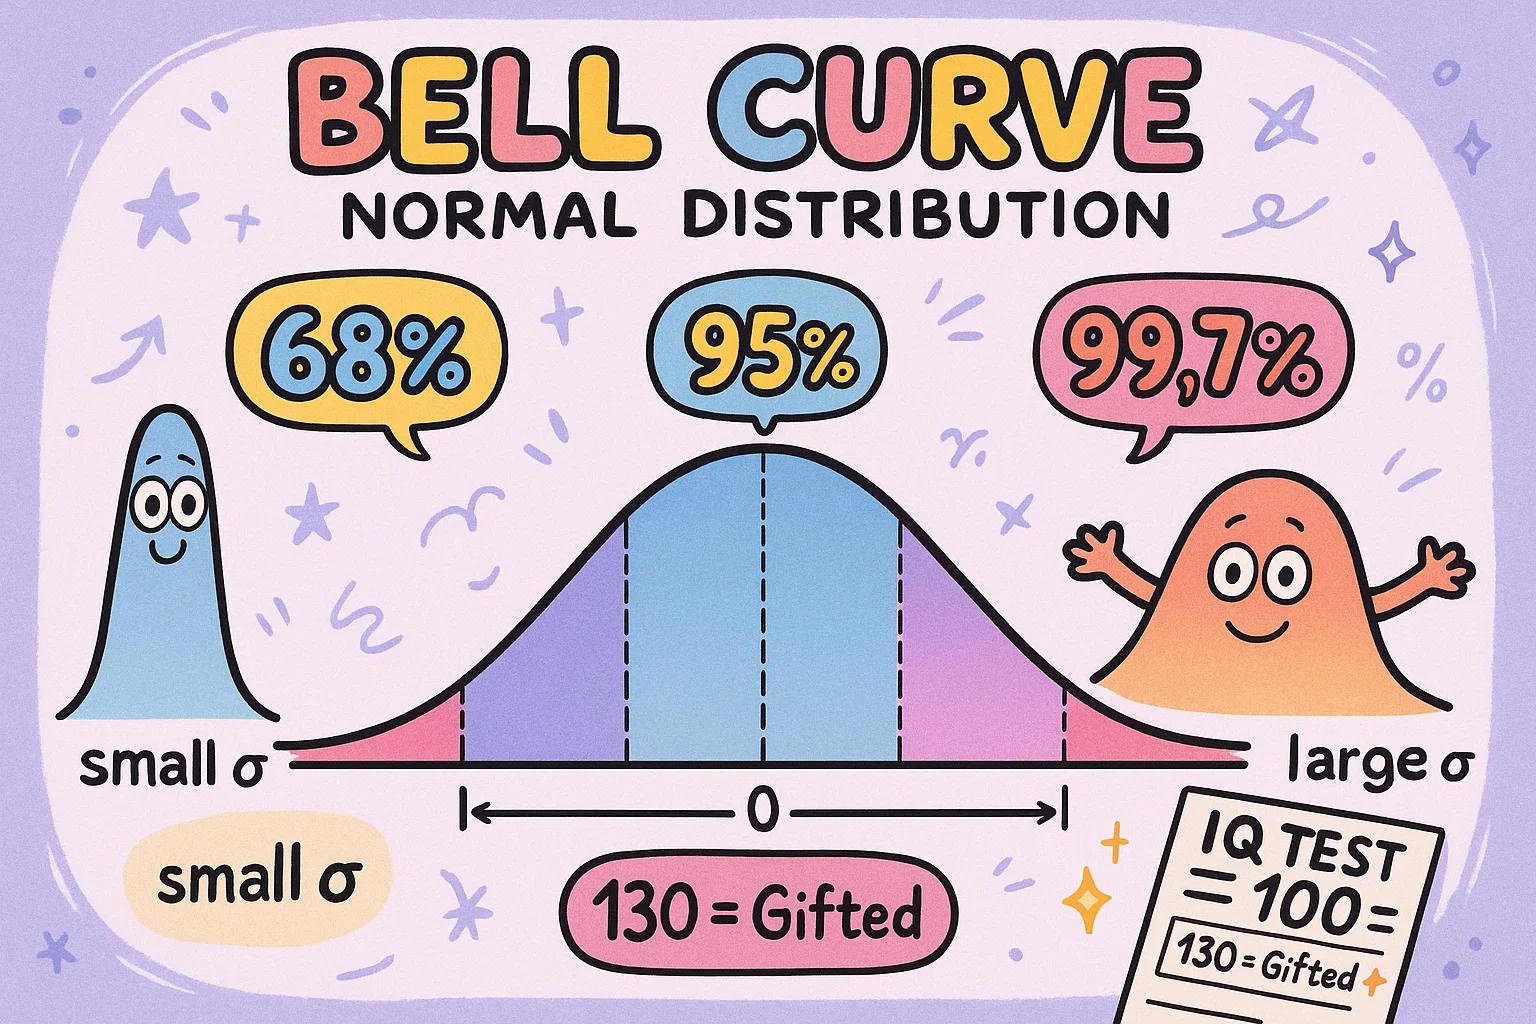
You’ve probably seen a bell curve before — that smooth, hill-shaped graph where most values sit in the middle and fewer show up at the extremes. It’s more than just a pretty curve. It represents what’s called a normal distribution, and it pops up all the time in real life: heights, IQ scores, test results, even blood pressure readings.
Now here’s where standard deviation comes in. It controls how wide or narrow that bell shape is. If most numbers are close to the average, you’ll see a tight, tall curve — meaning a small standard deviation. But if the numbers are more spread out, the curve stretches wider and gets shorter, which means a larger standard deviation.
There’s a handy rule for this:
-
68% of values fall within 1 standard deviation of the mean
-
95% within 2
-
And 99.7% within 3
This makes it super easy to understand how typical (or unusual) a number is — whether you're analyzing test scores or stock returns.
🎯 Fun Fact: Most IQ tests are built so that scores follow a bell curve — with an average of 100 and a standard deviation of 15. That’s why a score of 130 is considered gifted!


